


A friend asked me to help her look at apartments. She’s in the middle of a life transition, trying to work out what she can afford. So I pulled up one-bedrooms near Thousand Oaks and started at the cheap end.
The third listing was a studio built into the side of somebody’s house. You get to it through an iron gate along the side yard. Under 350 square feet including the bathroom. Hard tile throughout. A closet drywalled into the middle of the room. A small counter, a sink, a cheap refrigerator, a range pushed against the end of the cabinets. Much of the floor plan is the walkway to the bathroom.
Nineteen hundred dollars a month.
What stopped me wasn’t the place, which is somebody’s home and probably serves them fine. It was that a market has evolved where something this sparse costs that much — and that it was the third-cheapest thing on the list. When I graduated from college I’d have guessed a space like that rented for $600.
Work backwards from the rent. To keep housing at a third of your take-home pay, that studio requires roughly $91,000 a year in California. About $44 an hour. For 350 square feet behind a side gate — and that assumes the job comes with health insurance. Someone earning $60,000, a real salary for a recent graduate, would be handing over close to half their take-home.
Ten years ago I rented a one-bedroom in Oak Park for $1,700, while starting a company and finishing an MBA. Eight hundred square feet. Living room, dining room, full kitchen, a deck. Covered parking. Washer and dryer in the unit. A walk-in closet. A bedroom that took a king with room left for a desk. There were tennis courts. I had friends over and we played Pictionary with nine people and there was room for it.
Same area. Ten years. More money for less than half the space.
So what actually happened?
Three things, in order.
After 2008 the country stopped building. For about fifteen years we added homes at a rate well below anything in the postwar era. That set the level everything else worked from.
Then demand arrived all at once. Remote work, the largest generation in American history hitting peak buying age, and the cheapest money in living memory. Prices jumped — and they jumped while mortgage rates were sitting at 3 percent.
Then rates doubled, and the market stopped moving.
The first two explain why housing is expensive. The third explains why it has stayed expensive, and why the homes we already have are increasingly lived in by the wrong people. A shortage, and then a traffic jam.
The correction that didn’t come
Start with something that didn’t behave the way I’d have expected.
Between 2021 and 2024, mortgage rates more than doubled. When borrowing gets more expensive, the thing you’re borrowing against is supposed to get cheaper. Buyers shop by monthly payment. If the payment buys less house, the price has to come down to meet it.
Take a $500,000 mortgage. At 3 percent that’s about $2,108 a month. At 6.58 percent — roughly where the thirty-year fixed sits now — the same loan costs $3,187. More than $1,000 extra every month, about $13,000 more a year. Run it the other way and you get the same answer: to hold the payment at $2,108, the loan would have to shrink to around $331,000. A third less.
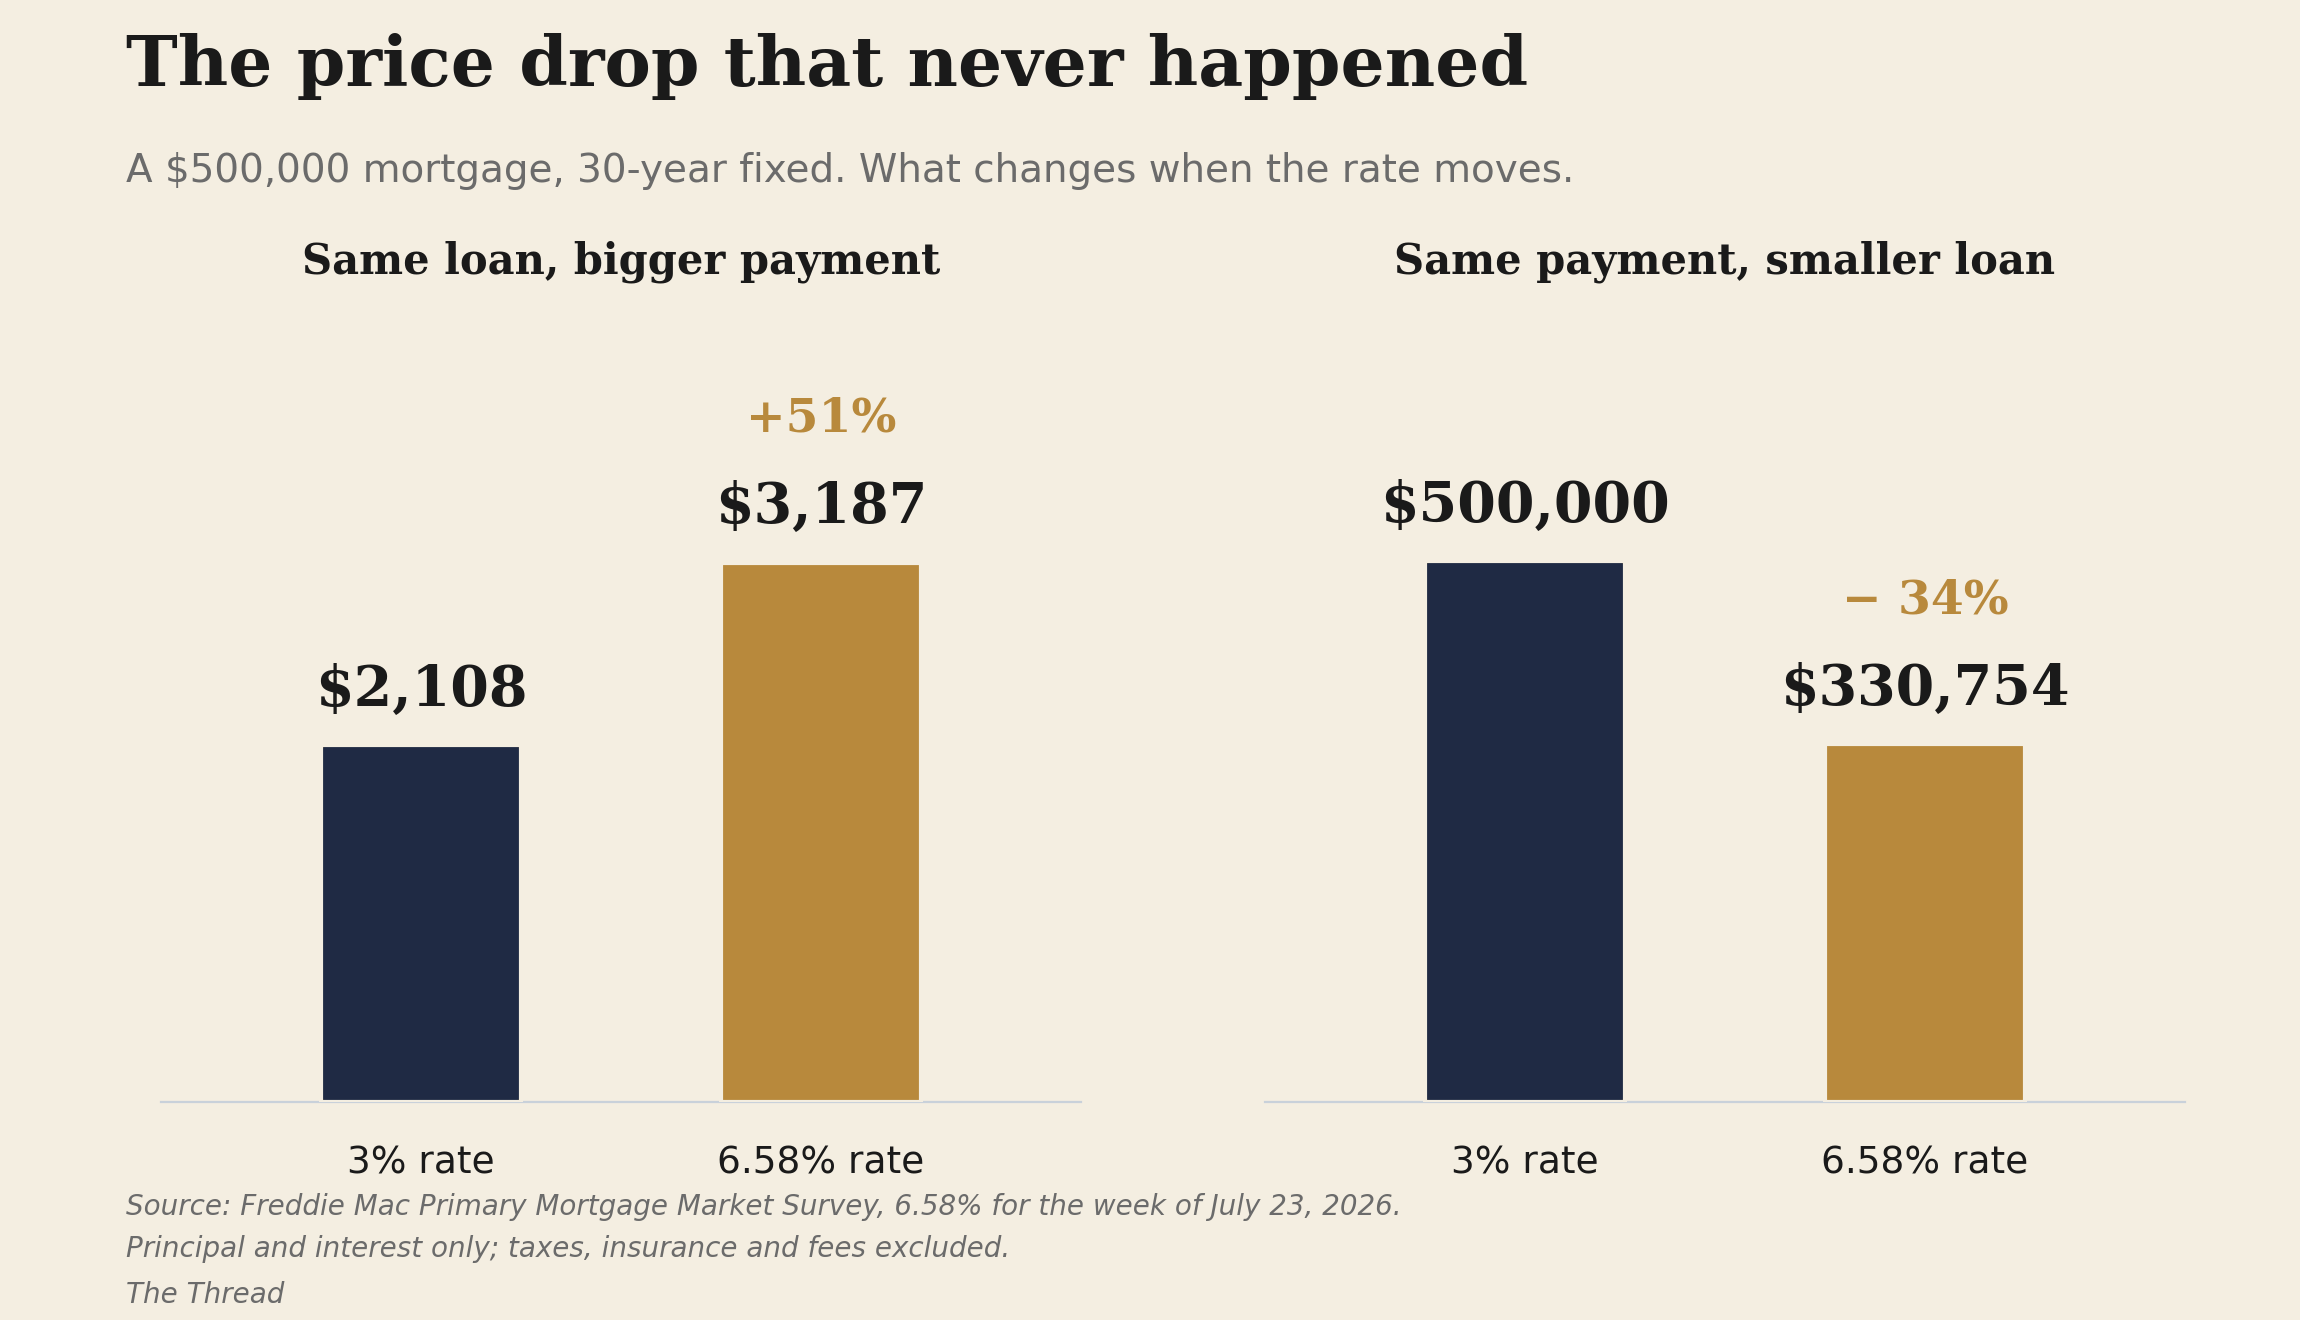
That is what should have happened to prices.
Instead they kept climbing for another two years, and only in the past few months have they finally begun to level off.
It’s tempting to look for someone to blame, and the usual suspects are foreign buyers and private equity. Both are real, and both are smaller than the conversation suggests — Freddie Mac and the Urban Institute have each found institutional investors to be a minor factor rather than the main one, and the ROAD to Housing Act, which became law in July, puts new limits on the largest of them anyway.
The bigger reason is quieter. Almost nobody holding a 3 percent mortgage is willing to sell.
The Federal Housing Finance Agency measured how strong that pull is. For every percentage point that market rates sit above the rate you already have, your odds of selling drop by 18 percent. By late 2023 the average borrower was locked in by more than three points. Fixed-rate home sales fell 57 percent in a single quarter, and roughly 1.7 million sales that would otherwise have happened simply didn’t.
The same researchers put a number on what that did to prices. The missing supply pushed them up about 6 percent. The higher cost of borrowing pushed them down about 3. The freeze was the stronger force, which is how a market that every model said should correct went up instead. Researchers at Harvard put rate lock at about 40 percent of the gap between the decline you’d have predicted for 2021 to 2023 and the growth that actually happened — and they find it bites hardest exactly where new construction is most constrained. The shortage and the freeze don’t sit side by side. They compound.
Something more American than most people realize
Mortgages exist everywhere. A thirty-year fixed-rate mortgage almost doesn’t.
Before the 1930s an American loan ran five to ten years, covered about half the purchase price, and came due in a lump at the end — you expected to renegotiate. When the Depression arrived and renegotiating stopped being possible, that structure turned a downturn into a wave of foreclosures.
So the federal government built something new. The Home Owners’ Loan Corporation refinanced mortgages already in default. The Federal Housing Administration began insuring a new kind of long-term loan. Fannie Mae was created to buy them. Congress didn’t authorize the thirty-year term itself until 1948, and not for existing homes until 1954.
It only works because the government stands behind it. No bank will hold thirty years of interest rate risk against deposits that can leave next month. What makes the product possible is that the risk gets sold on — the loan is packaged into a security, Fannie Mae or Freddie Mac or Ginnie Mae guarantees it, and bond investors buy the paper. The United States is the only country where the thirty-year fixed is the standard home loan, and the research is direct about why: government policy made it so.
Which is why rate lock-in is a uniquely American problem. Where mortgages reprice every few years, a rate rise cools prices the way the textbook says. Here it leaves millions of households holding a financial asset they can only keep by staying exactly where they are.
And the thirty-year fixed did what it was built to do. Homeownership went from 43.6 percent in 1940 to about 62 percent in 1960 — eighteen points in twenty years, one of the most successful things the federal government has ever engineered. Then it stopped. The rate has moved only a few points in the six decades since; it sits near 65 percent today, while the support kept accumulating. The guarantee, the mortgage interest deduction, later Proposition 13 and a capital gains exclusion.
Which raises a question. If decades of help aren’t producing more owners, what is the help doing?
It’s going into the price of homes that are already owned.
Ed Pinto at the American Enterprise Institute, who has spent a career in housing finance, reads the same flat line and draws a blunter conclusion: the product never really broadened ownership the way it was meant to.
What the freeze looks like from my side of the desk
Here’s the math I find myself running for people in this spot. Say a couple owns a home worth about $1.5 million, bought decades ago, with roughly $600,000 still owed at a rate near 3 percent. The house is two stories, which is starting to matter. It’s more house than two people need now that the kids have moved out.
It used to be easy to recommend downsizing. Sell the big place, buy something smaller, cut the payment, free up cash. That advice doesn’t work the way it used to.
Selling runs about 6 percent in transaction costs — $90,000. Then the tax. They paid roughly $400,000 for the house decades ago, so the gain is about $1.1 million. The first $500,000 is excluded — a threshold that hasn’t been raised since 1997 — and the remaining $600,000 is taxable. Federal capital gains, the surtax on investment income, and California’s own bite come to roughly $160,000.
So: $250,000 to move. None of which has anything to do with the house they’d be buying. It’s the price of leaving.
One piece of relief. For Californians over fifty-five, Proposition 19 lets them carry the low property tax assessment they’ve had for decades to a new house. Without it, what follows would be worse.
Even with it, here’s how the arithmetic runs.
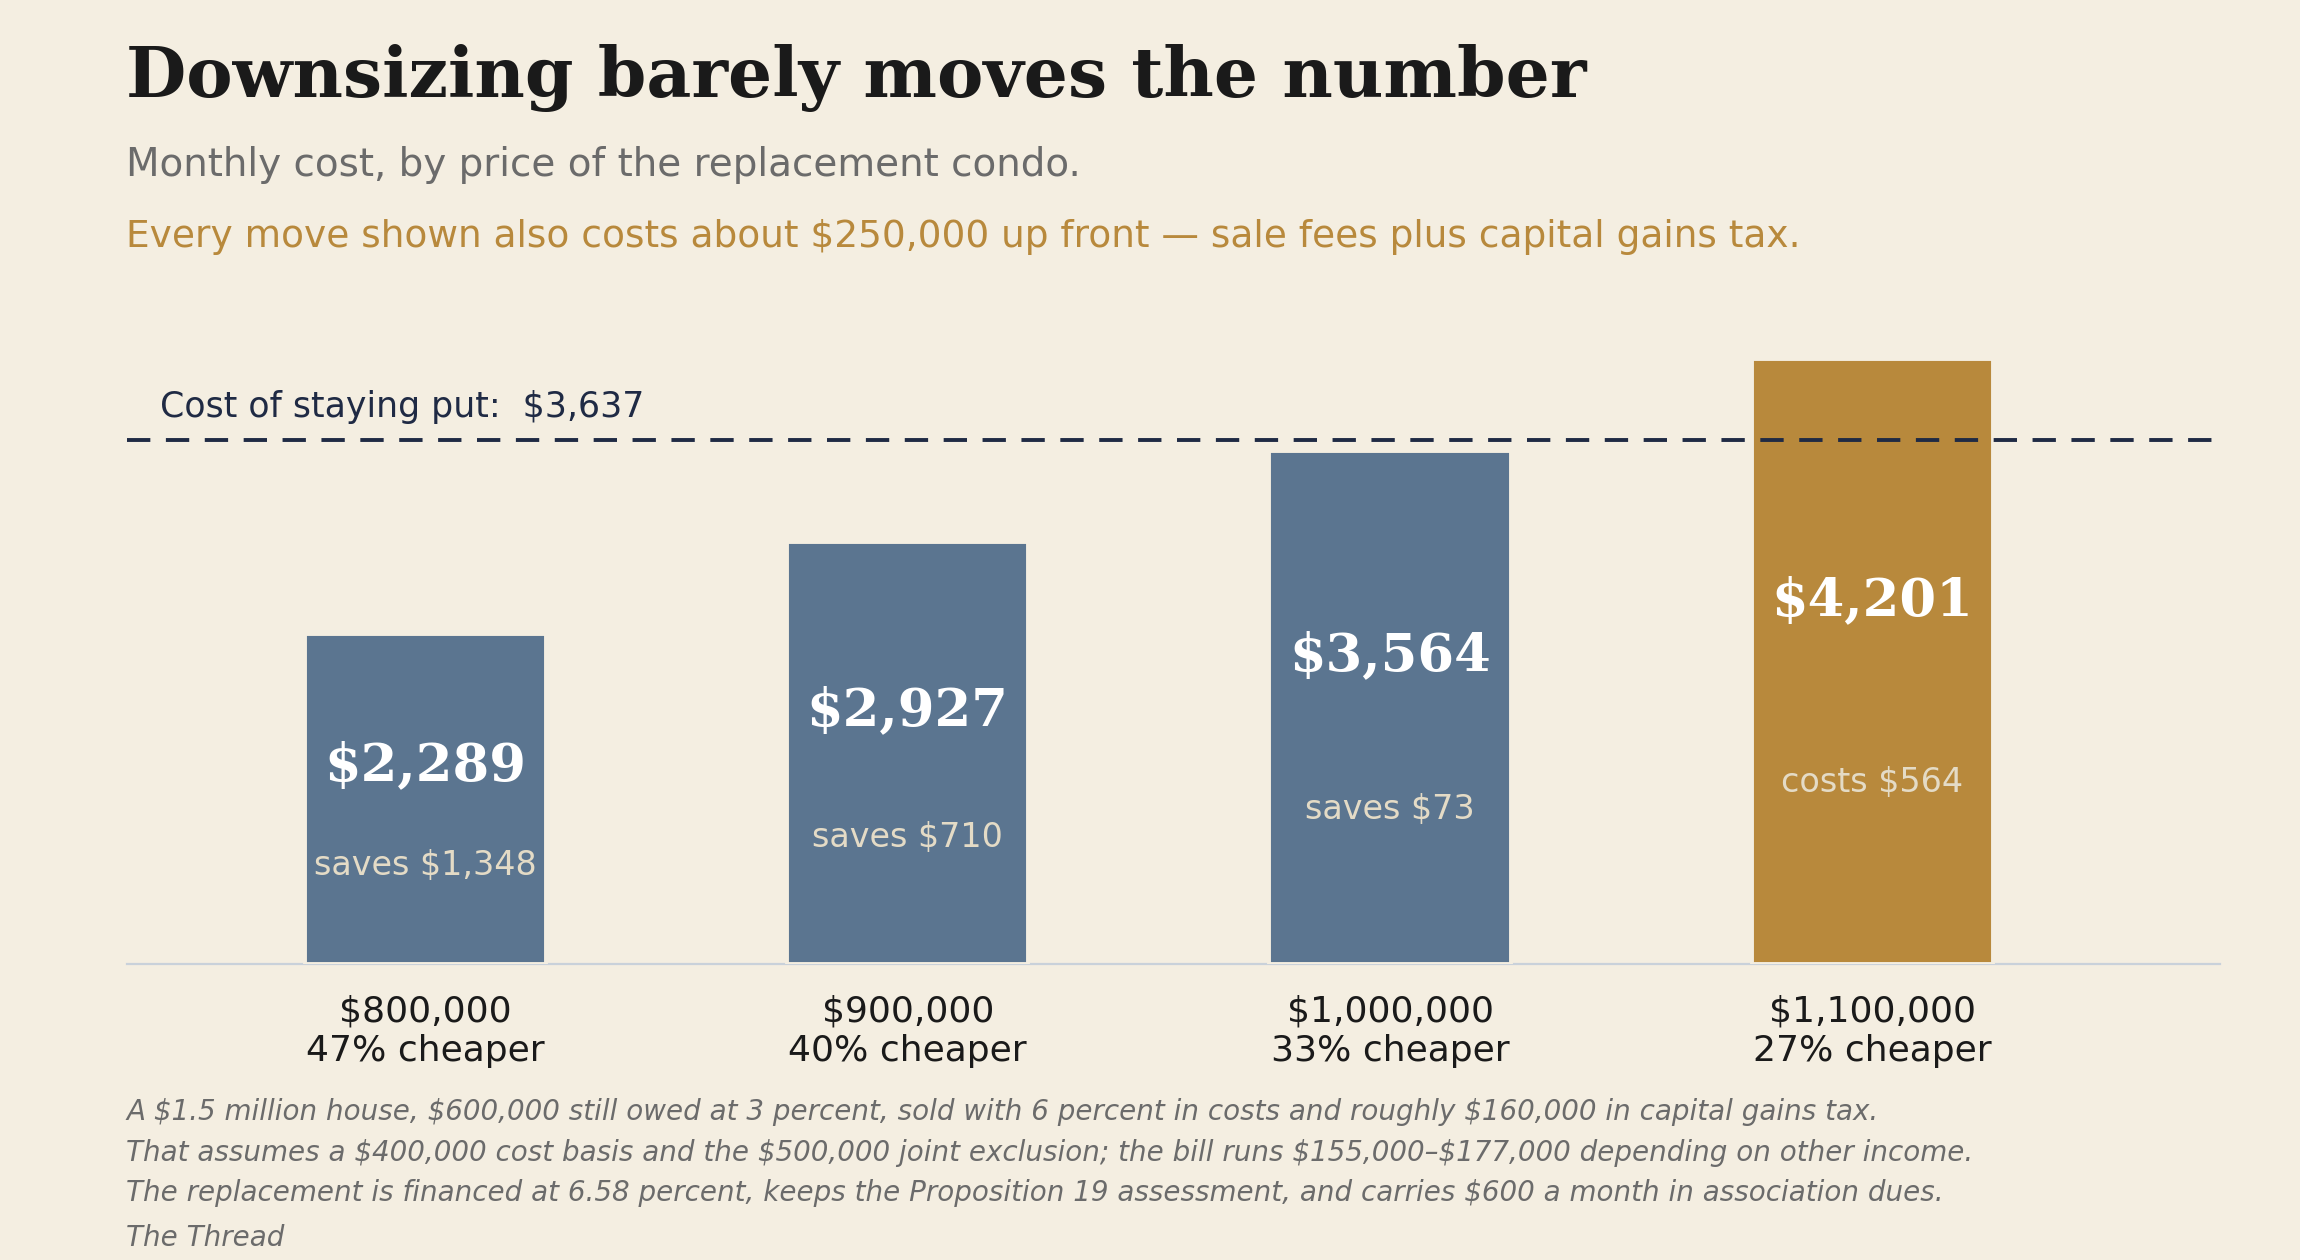
Look at where break-even falls. To hold their monthly cost flat, they have to buy something a third cheaper than the house they’re selling. Not smaller. A third cheaper. And around here, a third below $1.5 million is potentially an ordinary condo.
Say they find something in the $800,000 range, about 47 percent below the sale price. They save around $1,350 a month. That’s real money, and for some households it’s the difference that matters. It also takes fifteen years of those savings to earn back what the move cost them.
They can free up cash flow, and sometimes that’s exactly what someone needs. What they can’t do is come out ahead. The equity leaves and the monthly number barely moves.
There’s a version of this that reaches its logical end. When mobility becomes the problem in a two-story home, the instinct is to move to a single-story house. Run the numbers, though, and putting an elevator into the home you already own can pencil out cheaper than buying the new place.
The traffic jam
Which brings me back to the studio, by a route I didn’t expect.
There’s a body of research on what economists call moving chains, and it begins from something obvious: when somebody moves into a home, they leave one behind. Evan Mast, writing in the Journal of Urban Economics, followed 52,000 people who moved into 686 newly built market-rate buildings across twelve American cities, then traced what happened to the homes they left — and the homes vacated by the people who took those, six rounds deep. His estimate is that every 100 new units built at the top of the market let 45 to 70 people move out of below-median-income neighborhoods, with almost all of that happening within five years. The finding has since been replicated with population-wide registry data in Finland and again in Sweden.
New construction is what adds homes. But notice what the research is actually tracking: not the new apartment itself, but the sequence of moves it sets off. Housing gets sorted by people moving.
That’s the part that has stopped. The couple who can’t afford to move don’t just stay in a house that’s too big. Their four-bedroom never comes back onto the market. The family who would have bought that house stays in the three-bedroom. The buyer who would have taken the three-bedroom stays in the condo. The person who would have taken the condo keeps renting. In a market that circulates, our couple sells the big house and buys a condo. The country doesn’t gain a home; one gets freed and another gets occupied. What changes is the fit. The four-bedroom goes to a family that needs four bedrooms, and the retirees get something they can manage. A market that circulates puts people in housing that matches their lives. A frozen one leaves people in homes they no longer need and growing families in homes they have outgrown.
Nobody has directly measured how much of the pressure at the bottom traces to owners who didn’t sell. Running the chain backwards is reasoning, not a finding.
The homes that were never built
The traffic jam would matter less if there were enough homes. There aren’t, and that’s the first cause — the one that set the level.
The St. Louis Fed laid the numbers out in April. Residential building permits ran at 7.3 per thousand people in 2005. By 2009 they were at 1.9 — a 74 percent collapse, and the lowest reading in a series that begins in 1960. By 2024 they had recovered to 4.3, which the Fed notes is still 35 percent below the 1960-to-2000 average of 6.6.
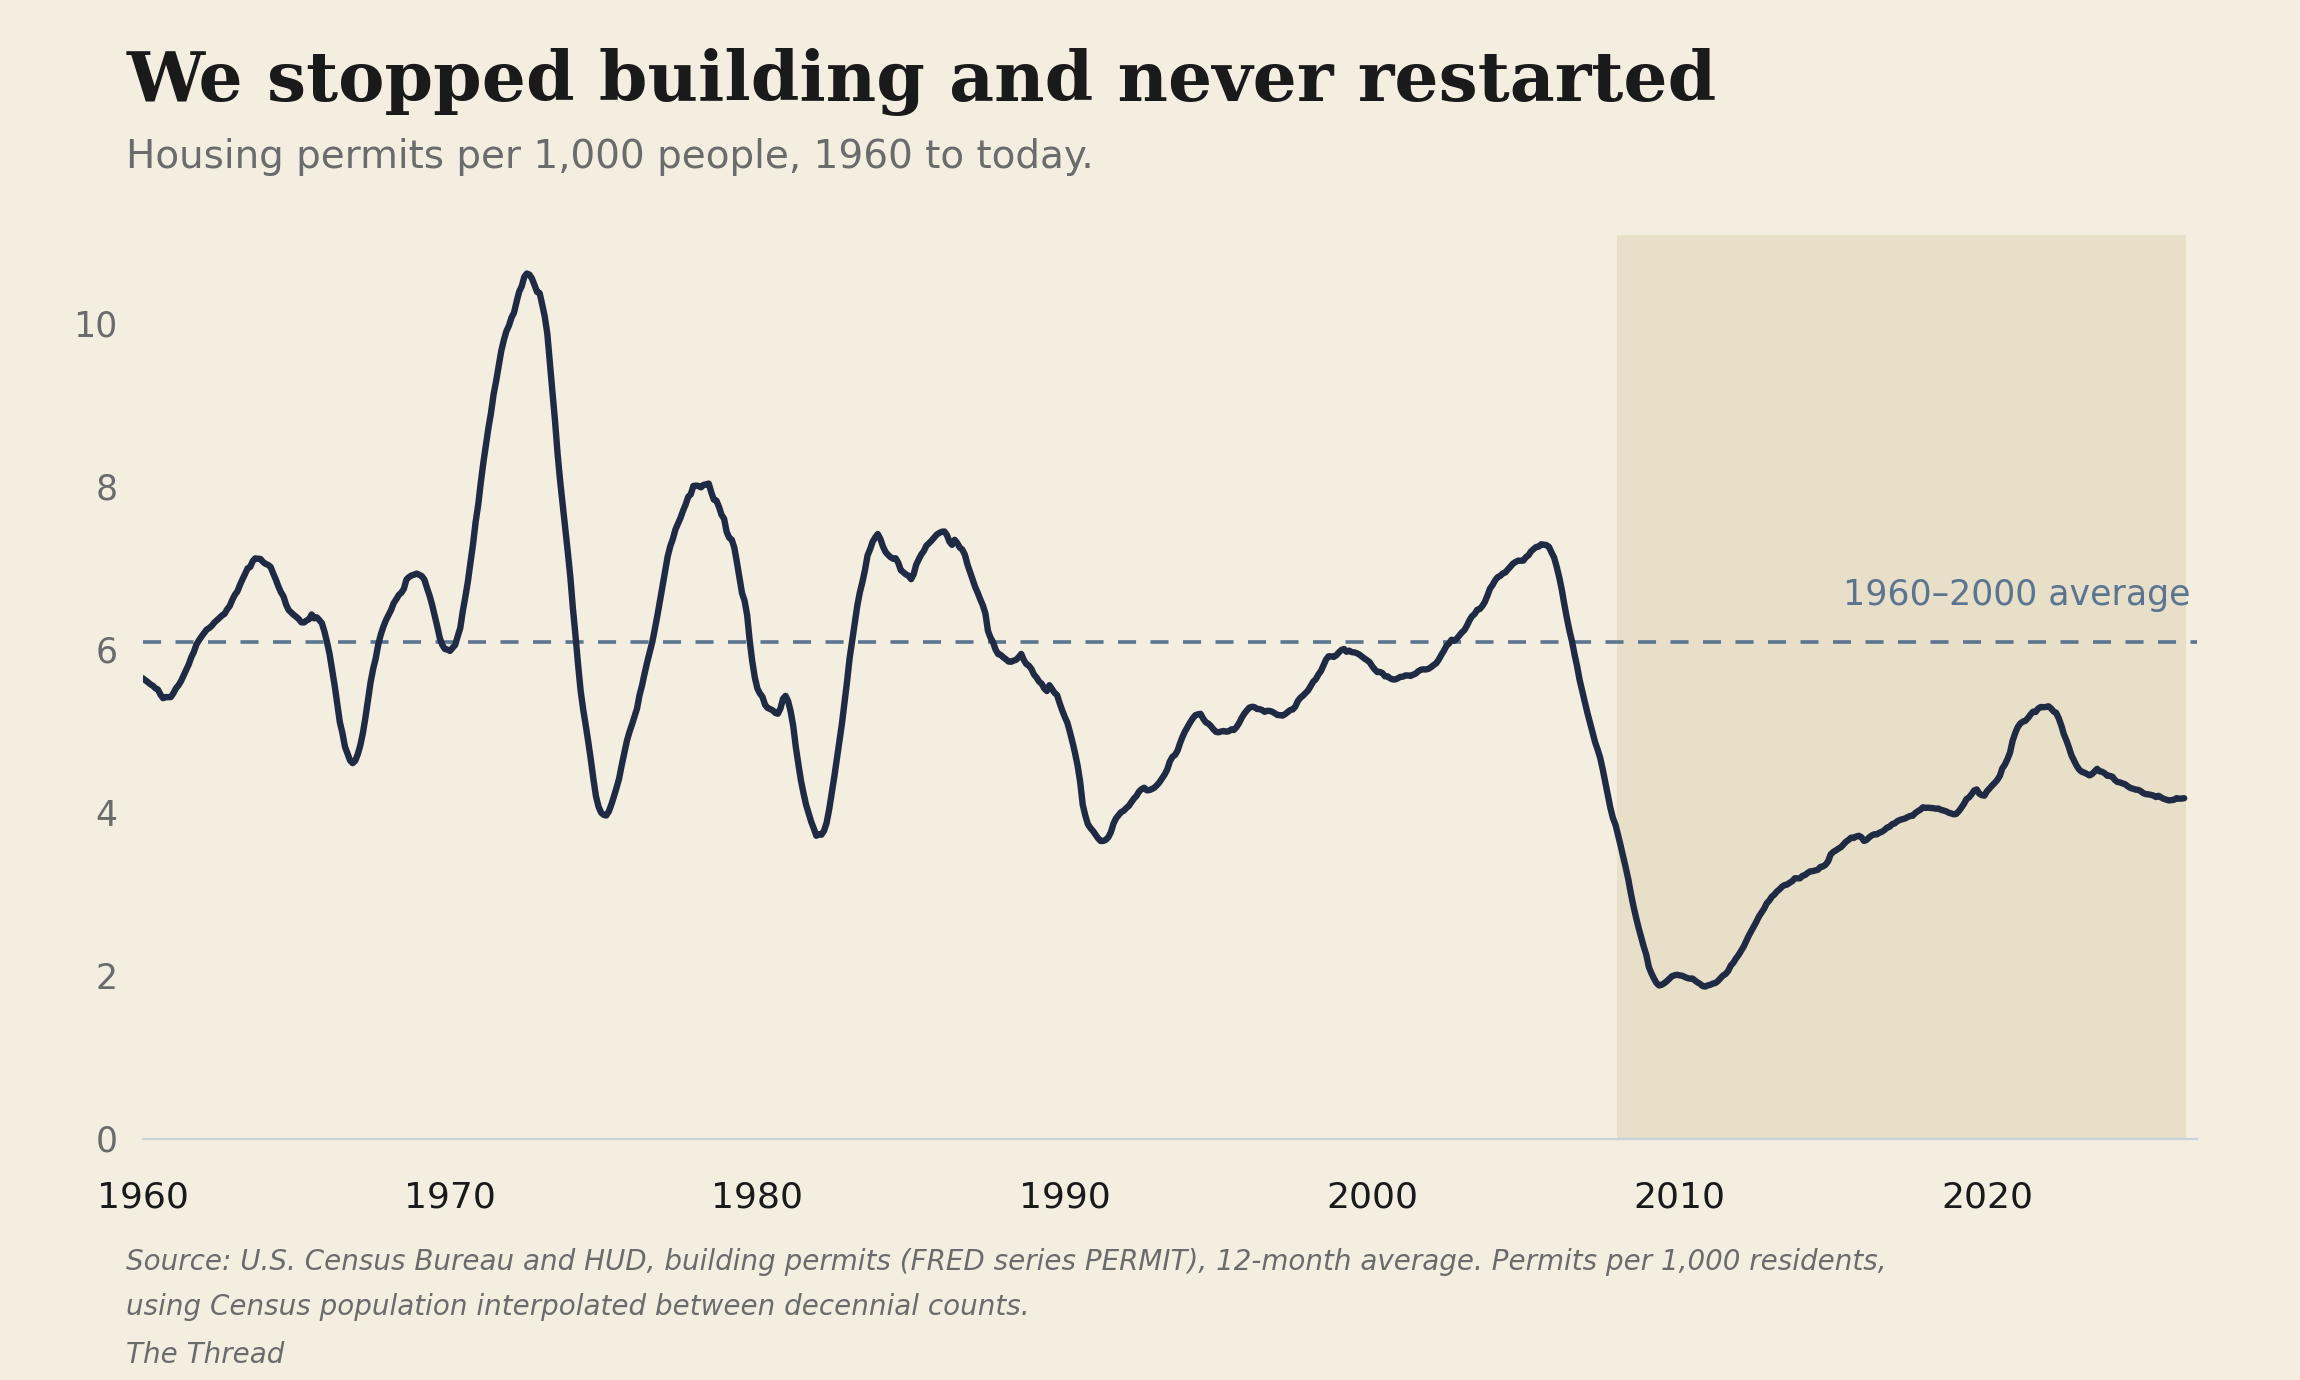
But the figure that stayed with me isn’t any single year. It’s that every month since 2008 has come in below that 1960-to-2000 average. 222 months. Not one of them above the line. A child born the year building collapsed is leaving for college now, and building still hasn’t recovered.
The capacity didn’t just pause, either. About 2.3 million construction jobs disappeared in the recession, and many of those workers never returned to the trades.
There’s a second loss in that, harder to see. The normal way housing becomes affordable isn’t that someone builds affordable housing. It’s that homes get old. People with money move to newer places, and the older stock drifts down the price ladder. Economists call it filtering, and it produced most of the affordable housing in this country without anyone planning it. Where new supply is blocked, filtering runs backwards — old homes get bought and renovated into expensive ones instead of aging into cheap ones.
Which is what the studio is. When a market can’t build apartments, and the homes that exist won’t change hands, and old houses get upgraded instead of filtering down, the supply that does appear comes through whatever door is left open. A homeowner, a side yard, a sheet of drywall, and a listing.
The people this lands on
The people this lands on are harder to count than you’d think.
The homeownership rate for adults under thirty-five was 37.4 percent in 1994, the first year of the current Census series. In 2025 it was 37.5. Read quickly, that says nothing has happened to young people, and it gets used that way.
But homeownership rates are calculated against households, not people. A twenty-eight-year-old living in her parents’ spare room isn’t counted as a young person who doesn’t own. She isn’t counted at all.
And that group has grown a lot. Urban Institute researchers found the share of twenty-five to thirty-four-year-olds living with their parents nearly doubled between 2000 and 2017, from about one in eight to more than one in five — roughly 5.6 million more adults under their parents’ roofs. The ownership rate held flat because the people who couldn’t get in stopped showing up in the count.
The usual explanation is a story about young people themselves. Coddled, soft, unwilling to leave. It’s a testable claim, and the test doesn’t support it. In separate work published in July, Urban split the change by income and by metro area. Among young adults earning under $20,000 in expensive markets, the share living with parents rose 16.4 percentage points between 2005 and 2024. Among the highest earners in those same markets, it rose 2.7.
Same generation. Same parents. Six times the effect at the bottom of the income scale. Culture doesn’t sort itself by income bracket and local home price. Prices do.
The common thread
So what do you do with this?
If you own, mostly nothing. Keep the rate. Keep the low property tax. Don’t trigger the gain. Let the house pass to your kids with a stepped-up basis. That’s the right advice for the household in front of me, and I’d tell my own family the same. And when the monthly numbers really are tight, the moves left are the ones people already reach for — a room rented out, a garage converted, a hard look at a reverse mortgage. Nobody wants to do any of those. They’re all ways of pulling money out of a house without leaving it, which is what you do when the exit costs $250,000.
It is also, repeated across generations, a large part of why nothing is moving. I don’t think that’s a contradiction so much as the shape of the problem. Every one of those individual decisions is correct, and the sum of them is a market that won’t budge.
If you’re on the other side of it, this isn’t about effort. The route your parents took — one income, a modest first house, a few years of saving — was open to more people than it is now. Needing help from family, or two incomes, or a co-signer to rent, isn’t a personal failing. The terms changed while the advice stayed the same.
I have tools for the couple with the house and the low rate. I don’t have a tool for someone whose problem is next month’s rent. My profession was built to arrange assets, and a growing number of people don’t have assets to arrange. They have a gap between what they earn and what shelter costs, and nothing I was trained on closes it.
What does work is building. More new housing has been delivered in the past two years than at any point in decades, and supply is the only force in this picture that reliably does anything. So if you want to know whether your own market is going to loosen, that’s the number to follow — permits pulled and units delivered where you live, not what rates do next.
Until next time, keep pulling.
— Matthew Davis
Disclosures
Matthew Davis is the co-founder of Sherwood Financial Partners, LLC (”Sherwood”). Sherwood is a registered investment adviser. This platform and this briefing are solely for informational purposes and do not intend to make an offer or solicitation for the sale or purchase of any specific securities, investments, or investment strategies. Investing involves risk and possible loss of principal capital. The information contained herein is not intended to convey or constitute legal or tax advice. Past performance is not indicative of future performance. Comments by viewers or third-party rankings and recognitions are no guarantee of future investment outcomes and do not ensure that a viewer will experience a higher level of performance or results. Public comments posted on this site are not selected, amended, deleted, or sorted in any way. If applicable, certain editing of personal identifiable information and misinformation may be deleted. The opinions expressed herein are those of certain Sherwood personnel and are subject to change without notice. The opinions referenced are as of the date of publication and are subject to revision due to changes in the market or economic conditions and may not necessarily come to pass. Any opinions, projections, or forward-looking statements expressed herein are solely those of author, may differ from the views or opinions expressed by other areas of the firm, and are only for general informational purposes as of the date indicated. Sherwood believes that the content provided by third parties and/or linked content is reasonably reliable and does not contain untrue statements of material fact or materially misleading information. This third-party content may be dated. This briefing may discuss and display charts, graphs, and formulas; these are not intended to be used by themselves to determine which securities to buy or sell or when to buy or sell them. Such charts, graphs, and formulas offer limited information and should not be used on their own to make investment decisions.


