

A quick note before you start: I'm trying something new with the audio version of this one. Rather than a straight read-through of the article, it's built as more of a narrated story — the same facts and the same sources, shaped to be easier to follow if you'd rather listen on a walk or a drive. I'd genuinely like to know whether it lands. Also available on Spotify and Apple Podcasts.
What I’m Pulling At
When I look at the national debt, I keep coming back to the same question: who is actually going to pay it off? The honest answer is my kids, and probably yours, and your grandkids. We are handing them the bill in a world that already feels hard to afford, and I can’t stop turning over how that is supposed to work. So this issue is me pulling the thread on it, as plainly as I can.
From “What Do We Do With No Debt?” to Here
It is easy to forget how recently the worry ran the other way. In 2001 the federal budget was in surplus, and the Congressional Budget Office was seriously projecting that the government would pay off its debt entirely by the end of the decade. That is not a typo. A quarter century later, the gross national debt sits above $39 trillion and is still climbing.
Before that number washes over you, let me put it in proportion, because a debt only means something next to the income behind it. A debt of $10,000 is heavy for someone earning $10,000 a year and barely a thought for someone earning $100,000. The useful question is not how many trillions, it is how big the debt is next to the economy. Measured that way, the part the government owes to outside lenders runs to about 100% of GDP, roughly a full year of everything the country produces. On current law it climbs to 120% by 2036. We have been near this height once before, at 106% right after World War II.
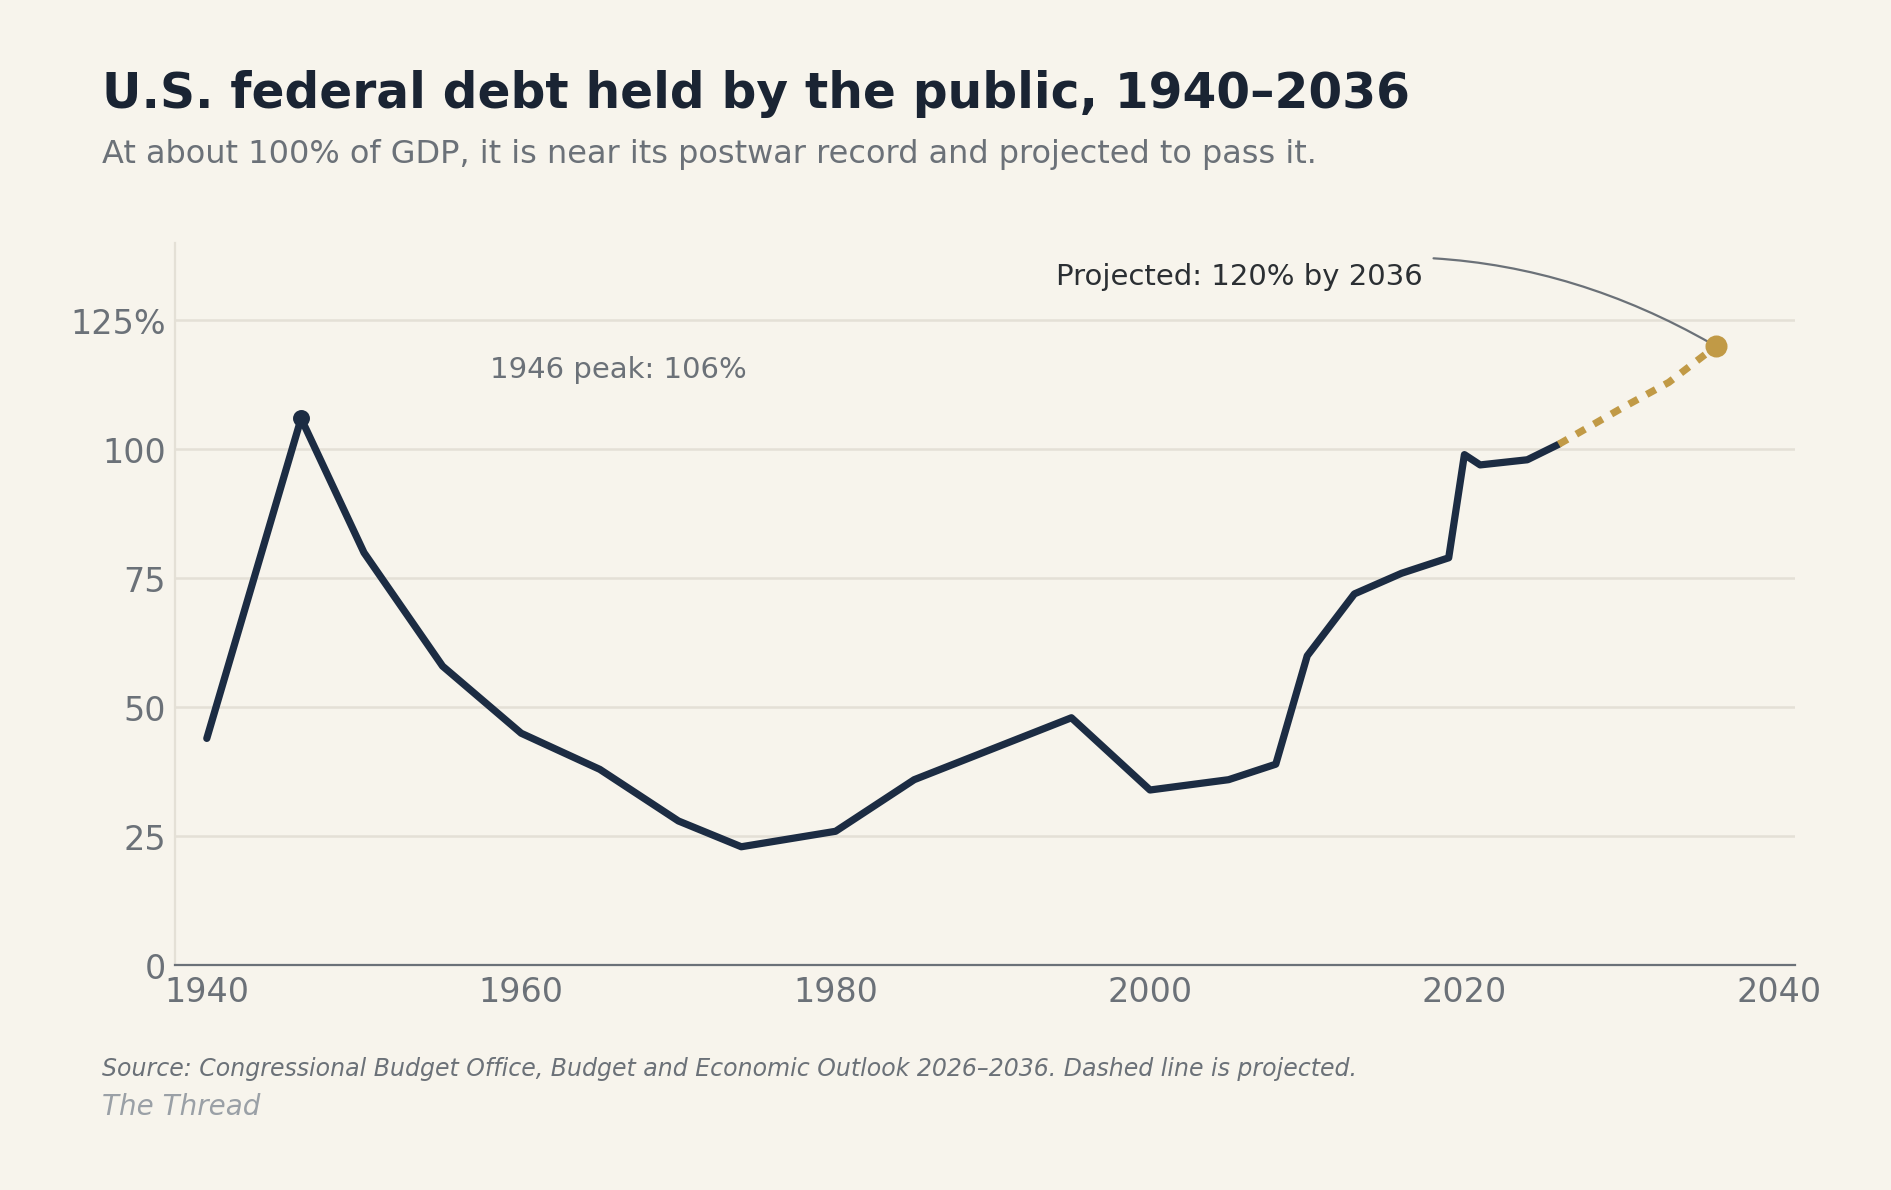
That 1946 comparison is worth holding onto. It is also where the easy comfort runs out, because how the country grew out of it then is mostly not available now. More on that shortly.
What We Borrowed For
A client asked me last month, not in a political way, where it all went. He wanted to know what we had to show for borrowing tens of trillions of dollars. It is a fair question, and the answer is more traceable than you would expect.
The Committee for a Responsible Federal Budget, a nonpartisan group that does this carefully, splits the rise in debt since 2001 into three buckets. Tax cuts are the largest, about 37 percentage points. Spending increases, including the post-9/11 wars in Iraq and Afghanistan and the expansion of Medicare, add about 33. The emergency responses to the 2008 financial crisis and the COVID pandemic make up the remaining 28 or so. The same group makes a separate point worth pausing on: by their accounting, roughly 77% of today’s debt traces to laws that passed with votes from both parties. This was not done to us by one side. We did it together.
Now strip off the labels, because this is the thread I keep pulling. Almost all of it was a way of making the present easier. We cushioned two crises, the 2008 crash and the pandemic, which most economists credit with preventing far deeper damage. We cut taxes to leave more money in people’s pockets today. We fought two wars whose returns are still argued over, and a third is now running up its own tab. The one large, lasting new commitment in the mix was more health care for older Americans. What you will barely find anywhere in those trillions is the kind of spending that builds something lasting, the infrastructure and research that make the next generation more prosperous. We borrowed, mostly, to feel less of the present, not to invest in the future.
The Cost of Carrying It
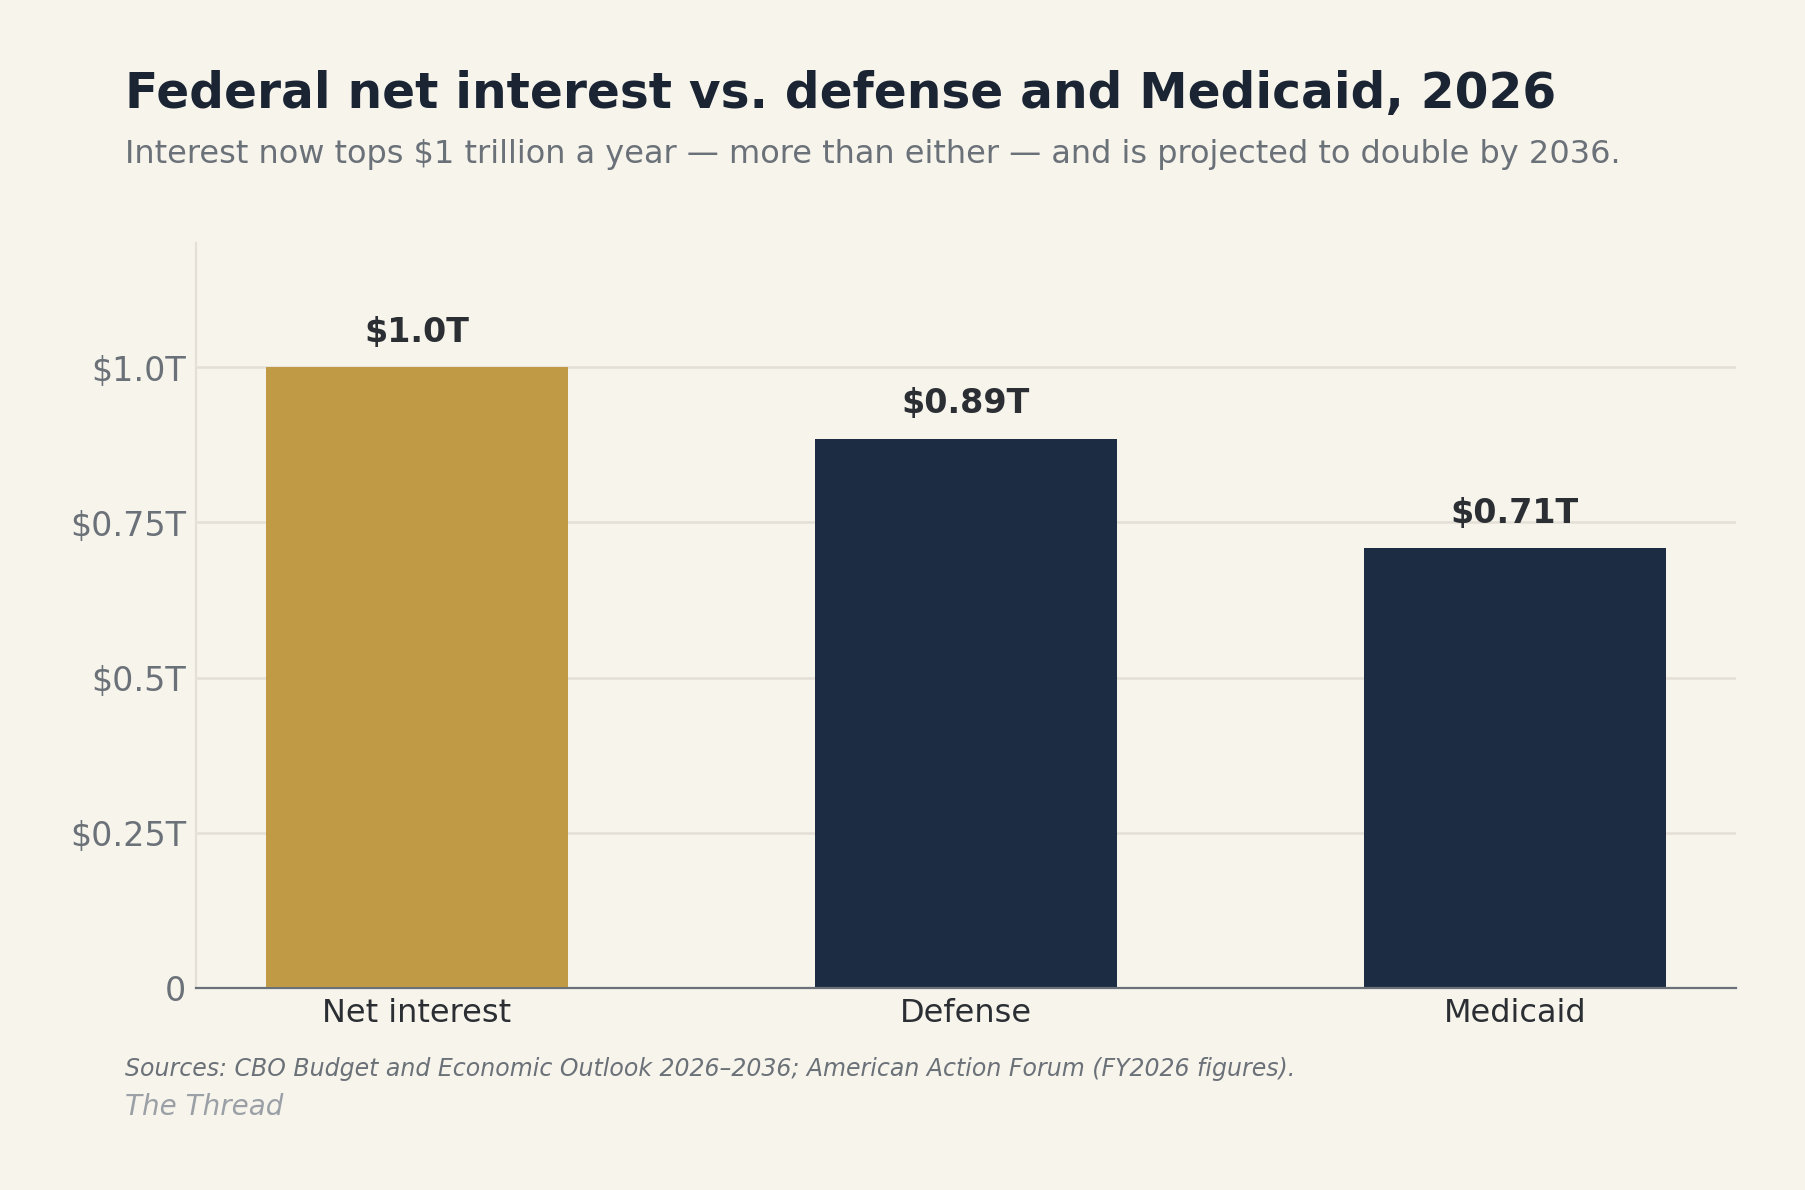
Carrying a balance this size has a price, and it is now one of the largest items in the entire budget. In 2026 the government’s annual interest bill reached $1 trillion. That is more than we spend on national defense (about $885 billion) and more than we spend on Medicaid (about $708 billion). Interest quietly passed defense a couple of years ago; this year it crossed a trillion, and on current projections it roughly doubles to $2.1 trillion by 2036.
A trillion dollars is hard to feel, so here is one way to hold it. Spread across every household in the country, that interest comes to roughly $7,500 a year, each. Not to pay the debt down. Just to keep it from growing.
What makes that worse is the arithmetic underneath it. When the interest rate the government pays climbs higher than the rate the economy grows, the debt starts to grow on its own, the way a credit card balance grows when the interest outruns what you can pay. We are not there yet, but the gap has narrowed. One recent sign: in May an auction of 30-year Treasury bonds cleared above 5%, the first 30-year auction to do so since 2007. Some of that was a spike in inflation worries tied to the Iran war, and some of it was lenders asking a little more to hold our longer debt. Neither is a crisis on its own, but it is a reminder that cheap borrowing was never guaranteed to last.
Why This Time Is Different
This is the part I think gets too little attention, and it is the real reason I wanted to write this. The country did climb down from that 1946 peak. But it had three things going for it then, and at least two of them are gone now.
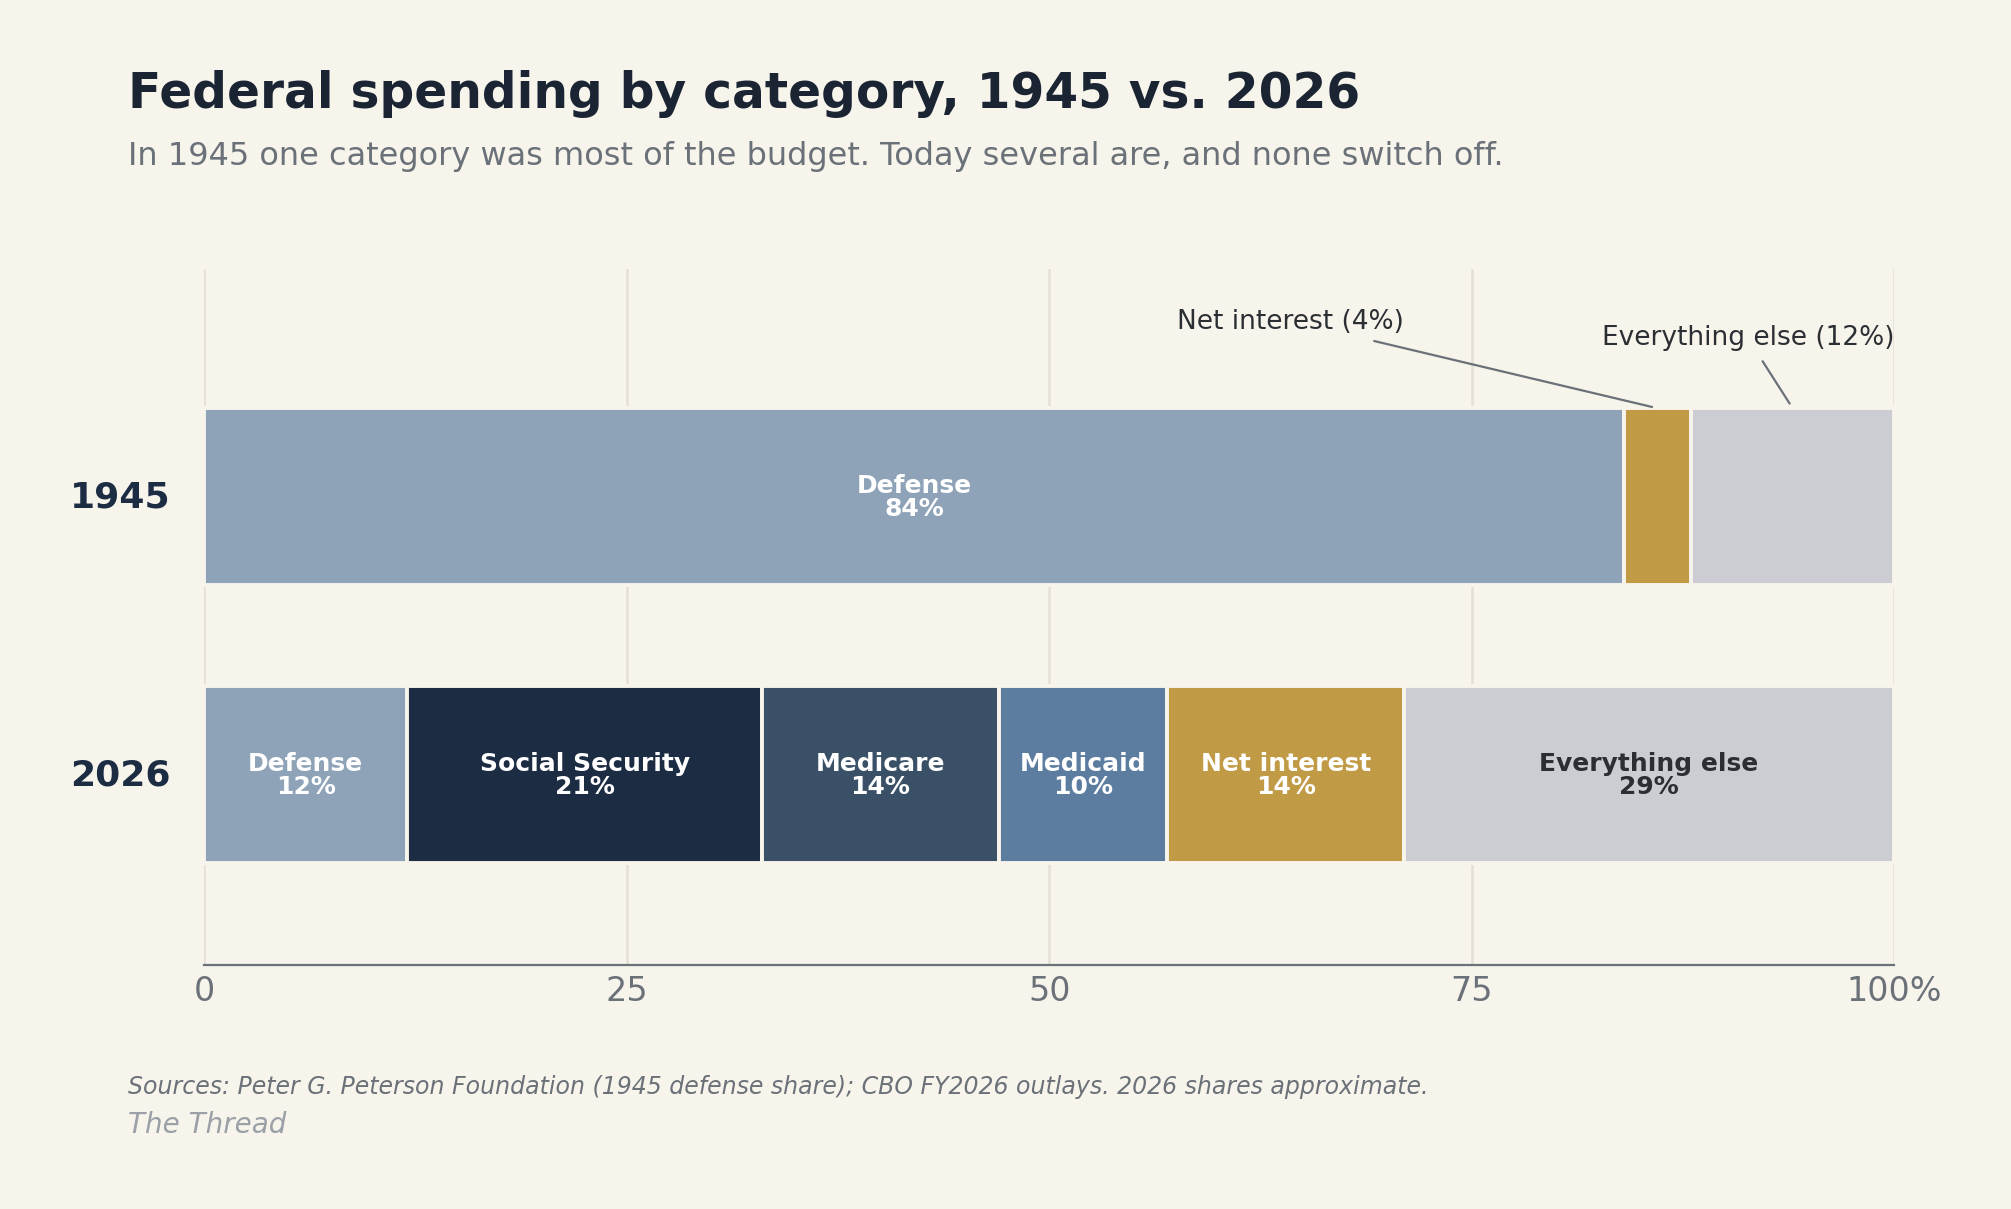
First, the Second World War ended, and an enormous share of the budget switched off with it. During the war, about 84 cents of every federal dollar went to defense. When it ended, most of that simply stopped; within a few years the government was spending barely a third of its wartime peak, almost entirely by sending the troops home. There is no comparable lever today. Defense is about 12% of the budget now, and you could disband the military entirely and still run a deficit of close to a trillion dollars, because the budget is now mostly Social Security, Medicare, Medicaid, and interest, none of which switch off the way wartime spending did in 1946. Second, the economy grew fast for a generation. Third, the working-age population was growing, with more workers arriving each year than retirees leaving. That last one has now reversed, and it is the heart of why this moment is not 1946.
Now look at Social Security and Medicare. They are not ordinary spending, and they are not gifts. They are benefits people have paid for, out of every paycheck, for 30 or 40 years, expecting a specific check in return. That is what makes them so hard to simply “cut”: the money was already collected on a promise. And they work. By the Census Bureau’s own accounting, Social Security and Medicare are among the most effective anti-poverty programs the country has; without Social Security, the share of Americans over 65 living in poverty would jump from about 10% to nearly 40%. The whole arrangement, though, rests on a ratio. In 1960 there were about five workers paying in for every person drawing benefits. Today it is closer to 2.7. By the middle of this century it is projected to fall below 2.5. Roughly 11,000 Americans turn 65 every day right now, and the generations behind them are smaller.
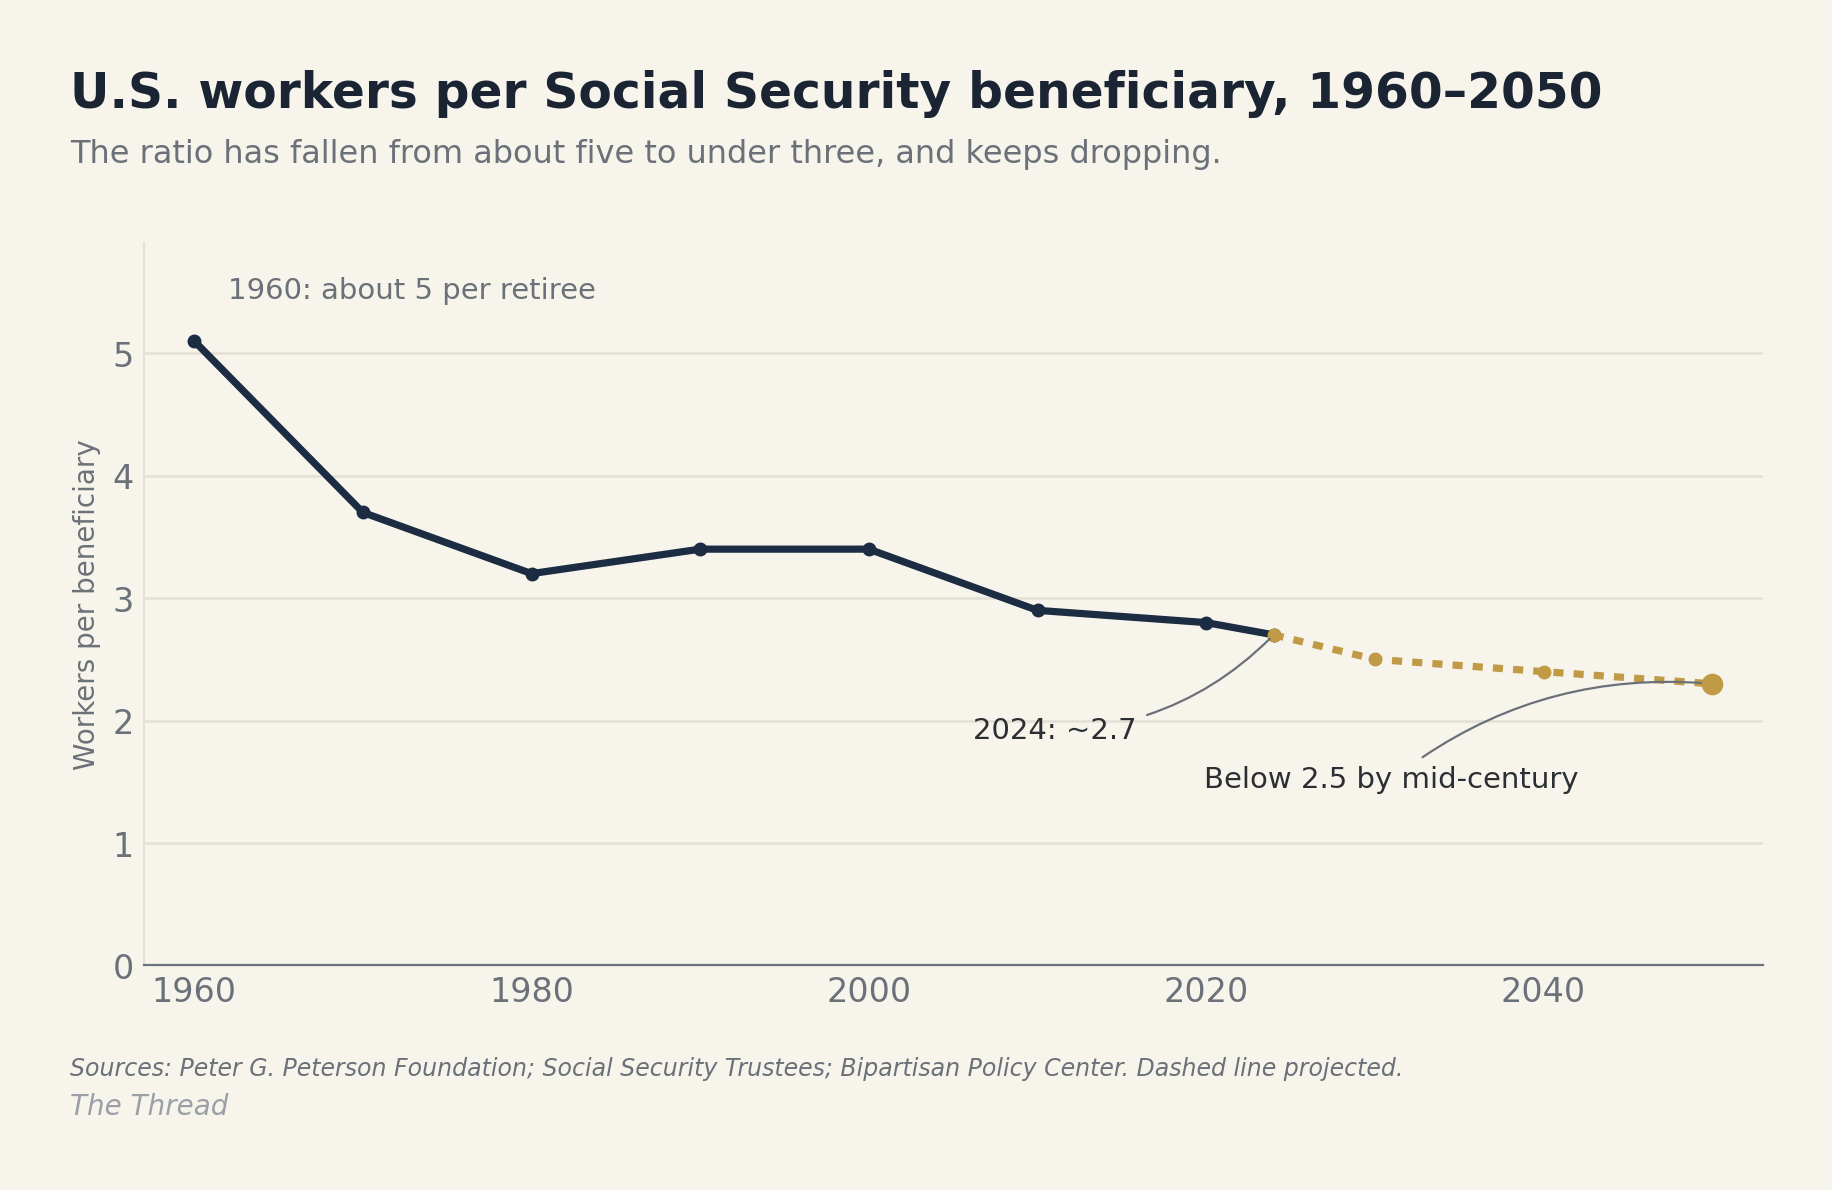
You can already see the strain. Social Security’s trustees project that the main retirement fund runs short around 2033, and after that the law would automatically cut benefits to about 77% of what was promised, unless Congress acts first. The CBO’s 2026 update moved that date a year closer, to about 2032, with cuts averaging nearer 28% in the years that follow. Medicare’s hospital fund runs on a similar clock. These are not distant abstractions for some future generation. They land on people who are working and planning right now.
The Questions I Keep Coming Back To
When I sit with all of this, the questions I keep circling are whether it just keeps getting worse, and whether anything can be done.
If we ignore it, yes, the math compounds. But this is not a cliff we drive off on a particular date, and that is the part the loudest headlines get wrong. The demographics do not set off a bomb. They force a decision. The automatic benefit cut I described is simply what happens if we keep declining to make it, and Congress has real ways to act: raise the revenue, adjust the benefits, or cover the gap from the general fund. What it cannot do is make the choice free. Every path has a cost, and that cost rises the longer we wait.
That is what actually concerns me, more than the size of any single number. A change phased in over twenty years is something families can plan around. The same change arriving all at once, the day a trust fund runs dry, falls on comfortable retirees and stretched households alike, and hardest on the ones with no cushion to absorb it. So the real question is not whether some number detonates. It is who ends up carrying the weight, and how fairly. The only way to truly fail here is to keep deciding not to decide, and to hand that choice, unsoftened, to the next generation.
What This Means for You
Honestly, less than the headlines might push you toward. A number this big tempts people into doing something dramatic with their money, and that is usually the wrong instinct.
Rates have jumped: a 30-year Treasury pushing 5% resets the floor under mortgage rates and under what safe bonds pay. How long that lasts is genuinely uncertain. Part of the recent move reflects an inflation scare tied to the Iran war, which could fade. But the underlying math, more and more debt to finance, continues to put upward pressure on rates. For savers, higher rates are not all bad news. For borrowers, and for anyone who had been counting on cheap money, it is a real shift. None of this is a signal to buy or sell anything. What it argues for is what it always does: diversification, and a plan that does not lean on any single outcome.
On Social Security and Medicare, I am not going to tell you to plan around a benefit cut. I do not think an abrupt one is the realistic base case, and the size of any eventual adjustment is still a choice, not a fixed fact. So the practical move is the unglamorous one: keep a plan flexible enough that it does not hinge on any single piece of this resolving a particular way.
The Common Thread
Pull it together and the thread is this. For twenty-five years we borrowed for the present. We took money from the future to get through a financial crisis and a pandemic, and we cut taxes to keep more in our pockets. Now the cost of that is climbing, the interest bill first, and the generation we would hand it to is already stretched by the cost of an ordinary life. I have written before about why so much of that ordinary life keeps getting more expensive; this is the same squeeze, seen from the public side of the ledger.
The number on its own is not destiny. It is the sum of choices we made and a demographic shift we can see coming with unusual clarity, and a country still gets to decide how it meets both. I do not find that comforting, but it does not have to be hopeless either. Seeing a thing clearly is what gives you the chance to act on it before someone else has to. We owe our kids at least that much, to look at this plainly while the choices are still ours and not yet theirs.
If you are a client and any of this raises a question about your own plan, just reply to this email. It comes straight to me. And if you know someone who would appreciate a calmer way to think about this, forward it along.
Until next time, keep pulling.
— Matthew Davis
Disclosures
Matthew Davis is the co-founder of Sherwood Financial Partners, LLC (”Sherwood”). Sherwood is a registered investment adviser. This platform and this briefing are solely for informational purposes and do not intend to make an offer or solicitation for the sale or purchase of any specific securities, investments, or investment strategies. Investing involves risk and possible loss of principal capital. The information contained herein is not intended to convey or constitute legal or tax advice. Past performance is not indicative of future performance. Comments by viewers or third-party rankings and recognitions are no guarantee of future investment outcomes and do not ensure that a viewer will experience a higher level of performance or results. Public comments posted on this site are not selected, amended, deleted, or sorted in any way. If applicable, certain editing of personal identifiable information and misinformation may be deleted. The opinions expressed herein are those of certain Sherwood personnel and are subject to change without notice. The opinions referenced are as of the date of publication and are subject to revision due to changes in the market or economic conditions and may not necessarily come to pass. Any opinions, projections, or forward-looking statements expressed herein are solely those of author, may differ from the views or opinions expressed by other areas of the firm, and are only for general informational purposes as of the date indicated. Sherwood believes that the content provided by third parties and/or linked content is reasonably reliable and does not contain untrue statements of material fact or materially misleading information. This third-party content may be dated. This briefing may discuss and display charts, graphs, and formulas; these are not intended to be used by themselves to determine which securities to buy or sell or when to buy or sell them. Such charts, graphs, and formulas offer limited information and should not be used on their own to make investment decisions.


